General Demographics for Veterans
Wisconsin - Total
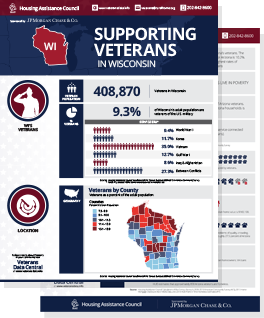
Source: ACS 2017-21 Five-Year National Estimates Veterans Select Demographic Data.
Run New Report
Wisconsin - Total |
United States |
||||||
| VETERAN POPULATION | Number | Percent | Number | Percent | |||
| Total Civilian Population Age 18 or Older Estimate | 4,575,020 | (X) | 254,296,179 | (X) | |||
| Veteran Population Age 18 or Older Estimate | 315,815 | 6.9 | 17,431,290 | 6.9 | |||
| Male Veteran Population Age 18 or Older Estimate | 291,652 | 92.3 | 15,794,025 | 90.6 | |||
| Female Veteran Population Age 18 or Older Estimate | 24,163 | 7.7 | 1,637,265 | 9.4 | |||
| AGE | |||||||
| Veteran Population Age 18 or Older Estimate | 315,815 | (X) | 17,431,290 | (X) | |||
| Veteran Population Ages 18 to 34 Estimate | 22,303 | 7.1 | 1,508,193 | 8.7 | |||
| Male Veteran Population Ages 18 to 34 Estimate | 19,317 | 86.6 | 1,236,709 | 82.0 | |||
| Female Veteran Population Ages 18 to 34 Estimate | 2,986 | 13.4 | 271,484 | 18.0 | |||
| Veteran Population Ages 35 to 54 Estimate | 65,297 | 20.7 | 4,151,603 | 23.8 | |||
| Male Veteran Population Ages 35 to 54 Estimate | 55,452 | 84.9 | 3,508,488 | 84.5 | |||
| Female Veteran Population Ages 35 to 54 Estimate | 9,845 | 15.1 | 643,115 | 15.5 | |||
| Veteran Population Ages 55 to 64 Estimate | 56,401 | 17.9 | 3,189,141 | 18.3 | |||
| Male Veteran Population Ages 55 to 64 Estimate | 49,875 | 88.4 | 2,796,781 | 87.7 | |||
| Female Veteran Population Ages 55 to 64 Estimate | 6,526 | 11.6 | 392,360 | 12.3 | |||
| Veteran Population Ages 65 to 74 Estimate | 90,156 | 28.5 | 4,513,992 | 25.9 | |||
| Male Veteran Population Ages 65 to 74 Estimate | 87,144 | 96.7 | 4,306,898 | 95.4 | |||
| Female Veteran Population Ages 65 to 74 Estimate | 3,012 | 3.3 | 207,094 | 4.6 | |||
| Veteran Population Ages 75 or Older Estimate | 81,658 | 25.9 | 4,068,361 | 23.3 | |||
| Male Veteran Population Ages 75 or Older Estimate | 79,864 | 97.8 | 3,945,149 | 97.0 | |||
| Female Veteran Population Ages 75 or Older Estimate | 1,794 | 2.2 | 123,212 | 3.0 | |||
| PERIOD OF SERVICE | |||||||
| Veteran Population Age 18 or Older Estimate | 315,815 | (X) | 17,431,290 | (X) | |||
| Veteran Population Age 18 or Older: Served in Gulf War II Estimate | 54,260 | 17.2 | 3,843,757 | 22.1 | |||
| Veteran Population Age 18 or Older: Served in Gulf War I Estimate | 55,159 | 17.5 | 3,908,610 | 22.4 | |||
| Veteran Population Age 18 or Older: Served in Vietnam War Estimate | 116,829 | 37.0 | 6,084,415 | 34.9 | |||
| Veteran Population Age 18 or Older: Served in Korean War Estimate | 23,575 | 7.5 | 1,149,257 | 6.6 | |||
| Veteran Population Age 18 or Older: Served in WW II Estimate | 8,074 | 2.6 | 383,739 | 2.2 | |||
| Veteran Population Age 18 or Older: Served Pre WW II Estimate | 32 | 0.0 | 3,926 | 0.0 | |||
| Veteran Population Age 18 or Older: Did Not Serve During War Estimate | 79,884 | 25.3 | 3,885,010 | 22.3 | |||
| RACE AND ETHNICITY | |||||||
| Veteran Population Age 18 or Older Estimate | 315,815 | (X) | 17,431,290 | (X) | |||
| White Alone-Includes Hispanic Veterans Estimate | 291,164 | 92.2 | 13,825,031 | 79.3 | |||
| Black Alone-Includes Hispanic Veterans Estimate | 11,074 | 3.5 | 2,129,670 | 12.2 | |||
| Native American /Alaska Native Alone-Includes Hispanic Veterans Estimate | 2,974 | 0.9 | 125,374 | 0.7 | |||
| Asian Alone-Includes Hispanic Veterans Estimate | 1,847 | 0.6 | 310,477 | 1.8 | |||
| Native Hawaiian/Other Pacific Islander Alone-Includes Hispanic Veterans Estimate | 145 | 0.0 | 34,529 | 0.2 | |||
| Some Other Race Alone-Includes Hispanic Veterans Estimate | 2,186 | 0.7 | 321,587 | 1.8 | |||
| Two Plus Races Alone-Includes Hispanic Veterans Estimate | 6,425 | 2.0 | 684,622 | 3.9 | |||
| White Non-Hispanic Veterans Estimate | 287,707 | 91.1 | 13,119,437 | 75.3 | |||
| Hispanic Veterans Estimate | 7,207 | 2.3 | 1,336,206 | 7.7 | |||
| SERVICE-CONNECTED DISABILITY RATING | |||||||
| Veteran Population Age 18 or Older Estimate | 315,815 | (X) | 17,431,290 | (X) | |||
| Veterans with Service-Connected Disability Rating Estimate | 72,164 | 22.9 | 4,437,140 | 25.5 | |||
| POVERTY | |||||||
| Veterans with Poverty and Disability Status Determined Estimate | 309,979 | (X) | 17,157,125 | (X) | |||
| Veterans Living Below the Poverty Level Estimate | 18,229 | 5.9 | 1,175,255 | 6.8 | |||
| DISABILITY | |||||||
| Veterans with Poverty and Disability Status Determined Estimate | 309,979 | (X) | 17,157,125 | (X) | |||
| Veterans with a Disability Estimate | 86,506 | 27.9 | 5,059,887 | 29.5 | |||
| Veterans with a Disability Living Below the Poverty Level Estimate | 7,370 | 8.5 | 488,736 | 9.7 | |||
| EMPLOYMENT AND UNEMPLOYMENT | |||||||
| Veteran Population 18 to 64 in Labor Force Estimate | 113,174 | (X) | 6,809,906 | (X) | |||
| Veteran Population 18 to 64 in Labor Force: Employed Estimate | 109,239 | 96.5 | 6,513,615 | 95.6 | |||
| Veteran Population 18 to 64 in Labor Force: Unemployed Estimate | 3,935 | 3.5 | 296,291 | 4.4 | |||
| Veteran Population 18 to 34 in Labor Force Estimate | 18,937 | (X) | 1,240,602 | (X) | |||
| Veteran Population 18 to 34 in Labor Force: Employed Estimate | 17,761 | 93.8 | 1,166,284 | 94.0 | |||
| Veteran Population 18 to 34 in Labor Force: Unemployed Estimate | 1,176 | 6.2 | 74,318 | 6.0 | |||
| Veteran Population 35 to 54 in Labor Force Estimate | 56,945 | (X) | 3,515,137 | (X) | |||
| Veteran Population 35 to 54 in Labor Force: Employed Estimate | 55,437 | 97.4 | 3,377,837 | 96.1 | |||
| Veteran Population 35 to 54 in Labor Force: Unemployed Estimate | 1,508 | 2.6 | 137,300 | 3.9 | |||
| Veteran Population 55 to 64 in Labor Force Estimate | 37,292 | (X) | 2,054,167 | (X) | |||
| Veteran Population 55 to 64 in Labor Force: Employed Estimate | 36,041 | 96.6 | 1,969,494 | 95.9 | |||
| Veteran Population 55 to 64 in Labor Force: Unemployed Estimate | 1,251 | 3.4 | 84,673 | 4.1 | |||
| EDUCATION | |||||||
| Veteran Population Age 25 or Older Estimate | 312,492 | (X) | 17,199,716 | (X) | |||
| Veteran Population Age 25 or Older: Less Than High School Graduate Estimate | 16,782 | 5.4 | 902,424 | 5.2 | |||
| Veteran Population Age 25 or Older: High School Graduate Estimate | 108,083 | 34.6 | 4,728,547 | 27.5 | |||
| Veteran Population Age 25 or Older: Some College and AA Degree, Less Than BA Degree Estimate | 112,625 | 36.0 | 6,413,978 | 37.3 | |||
| Veteran Population Age 25 or Older: BA Degree or More Estimate | 75,002 | 24.0 | 5,154,767 | 30.0 | |||
State Profile: Wisconsin (WI)
View another State Profile:
6.8% of veterans live in poverty
There are more than 1.6 million women veterans