General Demographics for Veterans
Pennington County, South Dakota
Source: ACS 2017-21 Five-Year National Estimates Veterans Select Demographic Data.
Run New Report
|
Data Reliability About Data
|
Pennington County, South Dakota |
United States |
||||||
| VETERAN POPULATION | Number | Percent | Reliability | Number | Percent | |||
| Total Civilian Population Age 18 or Older Estimate | 82,671 | (X) | 254,296,179 | (X) | ||||
| Veteran Population Age 18 or Older Estimate | 9,873 | 11.9 | 17,431,290 | 6.9 | ||||
| Male Veteran Population Age 18 or Older Estimate | 9,060 | 91.8 | 15,794,025 | 90.6 | ||||
| Female Veteran Population Age 18 or Older Estimate | 813 | 8.2 | 1,637,265 | 9.4 | ||||
| AGE | ||||||||
| Veteran Population Age 18 or Older Estimate | 9,873 | (X) | 17,431,290 | (X) | ||||
| Veteran Population Ages 18 to 34 Estimate | 819 | 8.3 | 1,508,193 | 8.7 | ||||
| Male Veteran Population Ages 18 to 34 Estimate | 643 | 78.5 | 1,236,709 | 82.0 | ||||
| Female Veteran Population Ages 18 to 34 Estimate | 176 | 21.5 | 271,484 | 18.0 | ||||
| Veteran Population Ages 35 to 54 Estimate | 2,311 | 23.4 | 4,151,603 | 23.8 | ||||
| Male Veteran Population Ages 35 to 54 Estimate | 2,113 | 91.4 | 3,508,488 | 84.5 | ||||
| Female Veteran Population Ages 35 to 54 Estimate | 198 | 8.6 | 643,115 | 15.5 | ||||
| Veteran Population Ages 55 to 64 Estimate | 1,986 | 20.1 | 3,189,141 | 18.3 | ||||
| Male Veteran Population Ages 55 to 64 Estimate | 1,834 | 92.3 | 2,796,781 | 87.7 | ||||
| Female Veteran Population Ages 55 to 64 Estimate | 152 | 7.7 | 392,360 | 12.3 | ||||
| Veteran Population Ages 65 to 74 Estimate | 2,761 | 28.0 | 4,513,992 | 25.9 | ||||
| Male Veteran Population Ages 65 to 74 Estimate | 2,578 | 93.4 | 4,306,898 | 95.4 | ||||
| Female Veteran Population Ages 65 to 74 Estimate | 183 | 6.6 | 207,094 | 4.6 | ||||
| Veteran Population Ages 75 or Older Estimate | 1,996 | 20.2 | 4,068,361 | 23.3 | ||||
| Male Veteran Population Ages 75 or Older Estimate | 1,892 | 94.8 | 3,945,149 | 97.0 | ||||
| Female Veteran Population Ages 75 or Older Estimate | 104 | 5.2 | 123,212 | 3.0 | ||||
| PERIOD OF SERVICE | ||||||||
| Veteran Population Age 18 or Older Estimate | 9,873 | (X) | 17,431,290 | (X) | ||||
| Veteran Population Age 18 or Older: Served in Gulf War II Estimate | 2,661 | 27.0 | 3,843,757 | 22.1 | ||||
| Veteran Population Age 18 or Older: Served in Gulf War I Estimate | 2,929 | 29.7 | 3,908,610 | 22.4 | ||||
| Veteran Population Age 18 or Older: Served in Vietnam War Estimate | 3,575 | 36.2 | 6,084,415 | 34.9 | ||||
| Veteran Population Age 18 or Older: Served in Korean War Estimate | 440 | 4.5 | 1,149,257 | 6.6 | ||||
| Veteran Population Age 18 or Older: Served in WW II Estimate | 200 | 2.0 | 383,739 | 2.2 | ||||
| Veteran Population Age 18 or Older: Served Pre WW II Estimate | 0.0 | 3,926 | 0.0 | |||||
| Veteran Population Age 18 or Older: Did Not Serve During War Estimate | 1,941 | 19.7 | 3,885,010 | 22.3 | ||||
| RACE AND ETHNICITY | ||||||||
| Veteran Population Age 18 or Older Estimate | 9,873 | (X) | 17,431,290 | (X) | ||||
| White Alone-Includes Hispanic Veterans Estimate | 8,854 | 89.7 | 13,825,031 | 79.3 | ||||
| Black Alone-Includes Hispanic Veterans Estimate | 228 | 2.3 | 2,129,670 | 12.2 | ||||
| Native American /Alaska Native Alone-Includes Hispanic Veterans Estimate | 270 | 2.7 | 125,374 | 0.7 | ||||
| Asian Alone-Includes Hispanic Veterans Estimate | 33 | 0.3 | 310,477 | 1.8 | ||||
| Native Hawaiian/Other Pacific Islander Alone-Includes Hispanic Veterans Estimate | 0.0 | 34,529 | 0.2 | |||||
| Some Other Race Alone-Includes Hispanic Veterans Estimate | 75 | 0.8 | 321,587 | 1.8 | ||||
| Two Plus Races Alone-Includes Hispanic Veterans Estimate | 413 | 4.2 | 684,622 | 3.9 | ||||
| White Non-Hispanic Veterans Estimate | 8,684 | 88.0 | 13,119,437 | 75.3 | ||||
| Hispanic Veterans Estimate | 352 | 3.6 | 1,336,206 | 7.7 | ||||
| SERVICE-CONNECTED DISABILITY RATING | ||||||||
| Veteran Population Age 18 or Older Estimate | 9,873 | (X) | 17,431,290 | (X) | ||||
| Veterans with Service-Connected Disability Rating Estimate | 3,618 | 36.6 | 4,437,140 | 25.5 | ||||
| POVERTY | ||||||||
| Veterans with Poverty and Disability Status Determined Estimate | 9,709 | (X) | 17,157,125 | (X) | ||||
| Veterans Living Below The Poverty Level Estimate | 555 | 5.7 | 1,175,255 | 6.8 | ||||
| DISABILITY | ||||||||
| Veterans with Poverty and Disability Status Determined Estimate | 9,709 | (X) | 17,157,125 | (X) | ||||
| Veterans with a Disability Estimate | 2,770 | 28.5 | 5,059,887 | 29.5 | ||||
| Veterans with a Disability Living Below the Poverty Level Estimate | 332 | 12.0 | 488,736 | 9.7 | ||||
| EMPLOYMENT AND UNEMPLOYMENT | ||||||||
| Veteran Population 18 to 64 in Labor Force Estimate | 4,333 | (X) | 6,809,906 | (X) | ||||
| Veteran Population 18 to 64 in Labor Force Employed Estimate | 4,169 | 96.2 | (X) | (X) | ||||
| Veteran Population 18 to 64 in Labor Force: Unemployed Estimate | 164 | 3.8 | 296,291 | 4.4 | ||||
| Veteran Population 18 to 34 in Labor Force Estimate | 707 | (X) | 1,240,602 | (X) | ||||
| Veteran Population 18 to 34 in Labor Force: Employed Estimate | 689 | 97.5 | 1,166,284 | 94.0 | ||||
| Veteran Population 18 to 34 in Labor Force: Unemployed Estimate | 18 | 2.5 | 74,318 | 6.0 | ||||
| Veteran Population 35 to 54 in Labor Force | 2,121 | (X) | (X) | (X) | ||||
| Veteran Population 35 to 54 in Labor Force: Employed | 2,049 | 96.6 | (X) | (X) | ||||
| Veteran Population 35 to 54 in Labor Force: Unemployed Estimate | 72 | 3.4 | 137,300 | 3.9 | ||||
| Veteran Population 55 to 64 in Labor Force Estimate | 1,505 | (X) | 2,054,167 | (X) | ||||
| Veteran Population 55 to 64 in Labor Force: Employed Estimate | 1,431 | 95.1 | 1,969,494 | 95.9 | ||||
| Veteran Population 55 to 64 in Labor Force: Unemployed Estimate | 74 | 4.9 | 84,673 | 4.1 | ||||
| EDUCATION | ||||||||
| Veteran Population Age 25 or Older Estimate | 9,758 | (X) | 17,199,716 | (X) | ||||
| Veteran Population Age 25 or Older: Less Than High School Graduate Estimate | 107 | 1.1 | 902,424 | 5.2 | ||||
| Veteran Population Age 25 or Older: High School Graduate Estimate | 2,351 | 24.1 | 4,728,547 | 27.5 | ||||
| Veteran Population Age 25 or Older: Some College and AA Degree, Less Than BA Degree Estimate | 3,823 | 39.2 | 6,413,978 | 37.3 | ||||
| Veteran Population Age 25 or Older: BA Degree or More Estimate | 3,477 | 35.6 | 5,154,767 | 30.0 | ||||
State Profile: South Dakota (SD)
View another State Profile:
In 2021, the VA guaranteed over 1.2 million home mortgage loans
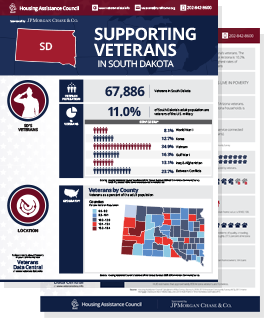
There are approximately 17.4 million veterans in the United States