General Demographics for Veterans
Lane County, Oregon
Source: ACS 2017-21 Five-Year National Estimates Veterans Select Demographic Data.
Run New Report
|
Data Reliability About Data
|
Lane County, Oregon |
United States |
||||||
| VETERAN POPULATION | Number | Percent | Reliability | Number | Percent | |||
| Total Civilian Population Age 18 or Older Estimate | 310,257 | (X) | 254,296,179 | (X) | ||||
| Veteran Population Age 18 or Older Estimate | 26,362 | 8.5 | 17,431,290 | 6.9 | ||||
| Male Veteran Population Age 18 or Older Estimate | 23,992 | 91.0 | 15,794,025 | 90.6 | ||||
| Female Veteran Population Age 18 or Older Estimate | 2,370 | 9.0 | 1,637,265 | 9.4 | ||||
| AGE | ||||||||
| Veteran Population Age 18 or Older Estimate | 26,362 | (X) | 17,431,290 | (X) | ||||
| Veteran Population Ages 18 to 34 Estimate | 2,295 | 8.7 | 1,508,193 | 8.7 | ||||
| Male Veteran Population Ages 18 to 34 Estimate | 1,848 | 80.5 | 1,236,709 | 82.0 | ||||
| Female Veteran Population Ages 18 to 34 Estimate | 447 | 19.5 | 271,484 | 18.0 | ||||
| Veteran Population Ages 35 to 54 Estimate | 5,177 | 19.6 | 4,151,603 | 23.8 | ||||
| Male Veteran Population Ages 35 to 54 Estimate | 4,396 | 84.9 | 3,508,488 | 84.5 | ||||
| Female Veteran Population Ages 35 to 54 Estimate | 781 | 15.1 | 643,115 | 15.5 | ||||
| Veteran Population Ages 55 to 64 Estimate | 4,701 | 17.8 | 3,189,141 | 18.3 | ||||
| Male Veteran Population Ages 55 to 64 Estimate | 4,145 | 88.2 | 2,796,781 | 87.7 | ||||
| Female Veteran Population Ages 55 to 64 Estimate | 556 | 11.8 | 392,360 | 12.3 | ||||
| Veteran Population Ages 65 to 74 Estimate | 7,446 | 28.2 | 4,513,992 | 25.9 | ||||
| Male Veteran Population Ages 65 to 74 Estimate | 7,060 | 94.8 | 4,306,898 | 95.4 | ||||
| Female Veteran Population Ages 65 to 74 Estimate | 386 | 5.2 | 207,094 | 4.6 | ||||
| Veteran Population Ages 75 or Older Estimate | 6,743 | 25.6 | 4,068,361 | 23.3 | ||||
| Male Veteran Population Ages 75 or Older Estimate | 6,543 | 97.0 | 3,945,149 | 97.0 | ||||
| Female Veteran Population Ages 75 or Older Estimate | 200 | 3.0 | 123,212 | 3.0 | ||||
| PERIOD OF SERVICE | ||||||||
| Veteran Population Age 18 or Older Estimate | 26,362 | (X) | 17,431,290 | (X) | ||||
| Veteran Population Age 18 or Older: Served in Gulf War II Estimate | 4,654 | 17.7 | 3,843,757 | 22.1 | ||||
| Veteran Population Age 18 or Older: Served in Gulf War I Estimate | 4,754 | 18.0 | 3,908,610 | 22.4 | ||||
| Veteran Population Age 18 or Older: Served in Vietnam War Estimate | 10,159 | 38.5 | 6,084,415 | 34.9 | ||||
| Veteran Population Age 18 or Older: Served in Korean War Estimate | 1,847 | 7.0 | 1,149,257 | 6.6 | ||||
| Veteran Population Age 18 or Older: Served in WW II Estimate | 519 | 2.0 | 383,739 | 2.2 | ||||
| Veteran Population Age 18 or Older: Served Pre WW II Estimate | 0.0 | 3,926 | 0.0 | |||||
| Veteran Population Age 18 or Older: Did Not Serve During War Estimate | 6,179 | 23.4 | 3,885,010 | 22.3 | ||||
| RACE AND ETHNICITY | ||||||||
| Veteran Population Age 18 or Older Estimate | 26,362 | (X) | 17,431,290 | (X) | ||||
| White Alone-Includes Hispanic Veterans Estimate | 24,383 | 92.5 | 13,825,031 | 79.3 | ||||
| Black Alone-Includes Hispanic Veterans Estimate | 232 | 0.9 | 2,129,670 | 12.2 | ||||
| Native American /Alaska Native Alone-Includes Hispanic Veterans Estimate | 180 | 0.7 | 125,374 | 0.7 | ||||
| Asian Alone-Includes Hispanic Veterans Estimate | 144 | 0.5 | 310,477 | 1.8 | ||||
| Native Hawaiian/Other Pacific Islander Alone-Includes Hispanic Veterans Estimate | 47 | 0.2 | 34,529 | 0.2 | ||||
| Some Other Race Alone-Includes Hispanic Veterans Estimate | 243 | 0.9 | 321,587 | 1.8 | ||||
| Two Plus Races Alone-Includes Hispanic Veterans Estimate | 1,133 | 4.3 | 684,622 | 3.9 | ||||
| White Non-Hispanic Veterans Estimate | 23,710 | 89.9 | 13,119,437 | 75.3 | ||||
| Hispanic Veterans Estimate | 1,219 | 4.6 | 1,336,206 | 7.7 | ||||
| SERVICE-CONNECTED DISABILITY RATING | ||||||||
| Veteran Population Age 18 or Older Estimate | 26,362 | (X) | 17,431,290 | (X) | ||||
| Veterans with Service-Connected Disability Rating Estimate | 7,365 | 27.9 | 4,437,140 | 25.5 | ||||
| POVERTY | ||||||||
| Veterans with Poverty and Disability Status Determined Estimate | 26,216 | (X) | 17,157,125 | (X) | ||||
| Veterans Living Below The Poverty Level Estimate | 2,432 | 9.3 | 1,175,255 | 6.8 | ||||
| DISABILITY | ||||||||
| Veterans with Poverty and Disability Status Determined Estimate | 26,216 | (X) | 17,157,125 | (X) | ||||
| Veterans with a Disability Estimate | 9,177 | 35.0 | 5,059,887 | 29.5 | ||||
| Veterans with a Disability Living Below the Poverty Level Estimate | 1,143 | 12.5 | 488,736 | 9.7 | ||||
| EMPLOYMENT AND UNEMPLOYMENT | ||||||||
| Veteran Population 18 to 64 in Labor Force Estimate | 8,591 | (X) | 6,809,906 | (X) | ||||
| Veteran Population 18 to 64 in Labor Force Employed Estimate | 7,971 | 92.8 | (X) | (X) | ||||
| Veteran Population 18 to 64 in Labor Force: Unemployed Estimate | 620 | 7.2 | 296,291 | 4.4 | ||||
| Veteran Population 18 to 34 in Labor Force Estimate | 1,885 | (X) | 1,240,602 | (X) | ||||
| Veteran Population 18 to 34 in Labor Force: Employed Estimate | 1,694 | 89.9 | 1,166,284 | 94.0 | ||||
| Veteran Population 18 to 34 in Labor Force: Unemployed Estimate | 191 | 10.1 | 74,318 | 6.0 | ||||
| Veteran Population 35 to 54 in Labor Force | 4,077 | (X) | (X) | (X) | ||||
| Veteran Population 35 to 54 in Labor Force: Employed | 3,799 | 93.2 | (X) | (X) | ||||
| Veteran Population 35 to 54 in Labor Force: Unemployed Estimate | 278 | 6.8 | 137,300 | 3.9 | ||||
| Veteran Population 55 to 64 in Labor Force Estimate | 2,629 | (X) | 2,054,167 | (X) | ||||
| Veteran Population 55 to 64 in Labor Force: Employed Estimate | 2,478 | 94.3 | 1,969,494 | 95.9 | ||||
| Veteran Population 55 to 64 in Labor Force: Unemployed Estimate | 151 | 5.7 | 84,673 | 4.1 | ||||
| EDUCATION | ||||||||
| Veteran Population Age 25 or Older Estimate | 26,145 | (X) | 17,199,716 | (X) | ||||
| Veteran Population Age 25 or Older: Less Than High School Graduate Estimate | 820 | 3.1 | 902,424 | 5.2 | ||||
| Veteran Population Age 25 or Older: High School Graduate Estimate | 5,494 | 21.0 | 4,728,547 | 27.5 | ||||
| Veteran Population Age 25 or Older: Some College and AA Degree, Less Than BA Degree Estimate | 12,642 | 48.4 | 6,413,978 | 37.3 | ||||
| Veteran Population Age 25 or Older: BA Degree or More Estimate | 7,189 | 27.5 | 5,154,767 | 30.0 | ||||
State Profile: Oregon (OR)
View another State Profile:
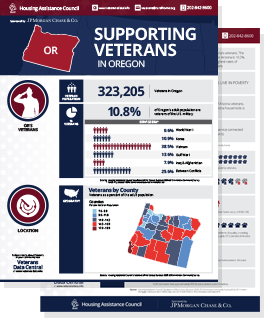
In the next 10 years, more than two-thirds of veterans will be over the age of 65
Veterans are more prevalent in Rural America than urban or suburban areas