General Demographics for Veterans
Cumberland County, North Carolina
Source: ACS 2017-21 Five-Year National Estimates Veterans Select Demographic Data.
Run New Report
|
Data Reliability About Data
|
Cumberland County, North Carolina |
United States |
||||||
| VETERAN POPULATION | Number | Percent | Reliability | Number | Percent | |||
| Total Civilian Population Age 18 or Older Estimate | 219,905 | (X) | 254,296,179 | (X) | ||||
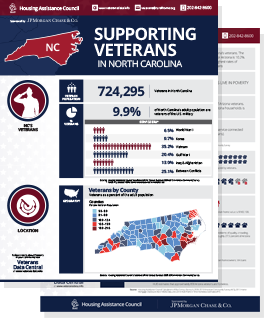
| Veteran Population Age 18 or Older Estimate | 41,253 | 18.8 | 17,431,290 | 6.9 | ||||
| Male Veteran Population Age 18 or Older Estimate | 32,585 | 79.0 | 15,794,025 | 90.6 | ||||
| Female Veteran Population Age 18 or Older Estimate | 8,668 | 21.0 | 1,637,265 | 9.4 | ||||
| AGE | ||||||||
| Veteran Population Age 18 or Older Estimate | 41,253 | (X) | 17,431,290 | (X) | ||||
| Veteran Population Ages 18 to 34 Estimate | 7,663 | 18.6 | 1,508,193 | 8.7 | ||||
| Male Veteran Population Ages 18 to 34 Estimate | 5,383 | 70.2 | 1,236,709 | 82.0 | ||||
| Female Veteran Population Ages 18 to 34 Estimate | 2,280 | 29.8 | 271,484 | 18.0 | ||||
| Veteran Population Ages 35 to 54 Estimate | 13,697 | 33.2 | 4,151,603 | 23.8 | ||||
| Male Veteran Population Ages 35 to 54 Estimate | 10,084 | 73.6 | 3,508,488 | 84.5 | ||||
| Female Veteran Population Ages 35 to 54 Estimate | 3,613 | 26.4 | 643,115 | 15.5 | ||||
| Veteran Population Ages 55 to 64 Estimate | 9,374 | 22.7 | 3,189,141 | 18.3 | ||||
| Male Veteran Population Ages 55 to 64 Estimate | 7,517 | 80.2 | 2,796,781 | 87.7 | ||||
| Female Veteran Population Ages 55 to 64 Estimate | 1,857 | 19.8 | 392,360 | 12.3 | ||||
| Veteran Population Ages 65 to 74 Estimate | 6,607 | 16.0 | 4,513,992 | 25.9 | ||||
| Male Veteran Population Ages 65 to 74 Estimate | 5,882 | 89.0 | 4,306,898 | 95.4 | ||||
| Female Veteran Population Ages 65 to 74 Estimate | 725 | 11.0 | 207,094 | 4.6 | ||||
| Veteran Population Ages 75 or Older Estimate | 3,912 | 9.5 | 4,068,361 | 23.3 | ||||
| Male Veteran Population Ages 75 or Older Estimate | 3,719 | 95.1 | 3,945,149 | 97.0 | ||||
| Female Veteran Population Ages 75 or Older Estimate | 193 | 4.9 | 123,212 | 3.0 | ||||
| PERIOD OF SERVICE | ||||||||
| Veteran Population Age 18 or Older Estimate | 41,253 | (X) | 17,431,290 | (X) | ||||
| Veteran Population Age 18 or Older: Served in Gulf War II Estimate | 19,432 | 47.1 | 3,843,757 | 22.1 | ||||
| Veteran Population Age 18 or Older: Served in Gulf War I Estimate | 16,851 | 40.8 | 3,908,610 | 22.4 | ||||
| Veteran Population Age 18 or Older: Served in Vietnam War Estimate | 9,405 | 22.8 | 6,084,415 | 34.9 | ||||
| Veteran Population Age 18 or Older: Served in Korean War Estimate | 1,143 | 2.8 | 1,149,257 | 6.6 | ||||
| Veteran Population Age 18 or Older: Served in WW II Estimate | 142 | 0.3 | 383,739 | 2.2 | ||||
| Veteran Population Age 18 or Older: Served Pre WW II Estimate | 0.0 | 3,926 | 0.0 | |||||
| Veteran Population Age 18 or Older: Did Not Serve During War Estimate | 5,396 | 13.1 | 3,885,010 | 22.3 | ||||
| RACE AND ETHNICITY | ||||||||
| Veteran Population Age 18 or Older Estimate | 41,253 | (X) | 17,431,290 | (X) | ||||
| White Alone-Includes Hispanic Veterans Estimate | 19,956 | 48.4 | 13,825,031 | 79.3 | ||||
| Black Alone-Includes Hispanic Veterans Estimate | 16,858 | 40.9 | 2,129,670 | 12.2 | ||||
| Native American /Alaska Native Alone-Includes Hispanic Veterans Estimate | 489 | 1.2 | 125,374 | 0.7 | ||||
| Asian Alone-Includes Hispanic Veterans Estimate | 446 | 1.1 | 310,477 | 1.8 | ||||
| Native Hawaiian/Other Pacific Islander Alone-Includes Hispanic Veterans Estimate | 151 | 0.4 | 34,529 | 0.2 | ||||
| Some Other Race Alone-Includes Hispanic Veterans Estimate | 1,179 | 2.9 | 321,587 | 1.8 | ||||
| Two Plus Races Alone-Includes Hispanic Veterans Estimate | 2,174 | 5.3 | 684,622 | 3.9 | ||||
| White Non-Hispanic Veterans Estimate | 18,143 | 44.0 | 13,119,437 | 75.3 | ||||
| Hispanic Veterans Estimate | 4,035 | 9.8 | 1,336,206 | 7.7 | ||||
| SERVICE-CONNECTED DISABILITY RATING | ||||||||
| Veteran Population Age 18 or Older Estimate | 41,253 | (X) | 17,431,290 | (X) | ||||
| Veterans with Service-Connected Disability Rating Estimate | 20,323 | 49.3 | 4,437,140 | 25.5 | ||||
| POVERTY | ||||||||
| Veterans with Poverty and Disability Status Determined Estimate | 40,562 | (X) | 17,157,125 | (X) | ||||
| Veterans Living Below The Poverty Level Estimate | 3,897 | 9.6 | 1,175,255 | 6.8 | ||||
| DISABILITY | ||||||||
| Veterans with Poverty and Disability Status Determined Estimate | 40,562 | (X) | 17,157,125 | (X) | ||||
| Veterans with a Disability Estimate | 12,625 | 31.1 | 5,059,887 | 29.5 | ||||
| Veterans with a Disability Living Below the Poverty Level Estimate | 1,417 | 11.2 | 488,736 | 9.7 | ||||
| EMPLOYMENT AND UNEMPLOYMENT | ||||||||
| Veteran Population 18 to 64 in Labor Force Estimate | 21,698 | (X) | 6,809,906 | (X) | ||||
| Veteran Population 18 to 64 in Labor Force Employed Estimate | 20,598 | 94.9 | (X) | (X) | ||||
| Veteran Population 18 to 64 in Labor Force: Unemployed Estimate | 1,100 | 5.1 | 296,291 | 4.4 | ||||
| Veteran Population 18 to 34 in Labor Force Estimate | 5,624 | (X) | 1,240,602 | (X) | ||||
| Veteran Population 18 to 34 in Labor Force: Employed Estimate | 5,241 | 93.2 | 1,166,284 | 94.0 | ||||
| Veteran Population 18 to 34 in Labor Force: Unemployed Estimate | 383 | 6.8 | 74,318 | 6.0 | ||||
| Veteran Population 35 to 54 in Labor Force | 10,626 | (X) | (X) | (X) | ||||
| Veteran Population 35 to 54 in Labor Force: Employed | 10,032 | 94.4 | (X) | (X) | ||||
| Veteran Population 35 to 54 in Labor Force: Unemployed Estimate | 594 | 5.6 | 137,300 | 3.9 | ||||
| Veteran Population 55 to 64 in Labor Force Estimate | 5,448 | (X) | 2,054,167 | (X) | ||||
| Veteran Population 55 to 64 in Labor Force: Employed Estimate | 5,325 | 97.7 | 1,969,494 | 95.9 | ||||
| Veteran Population 55 to 64 in Labor Force: Unemployed Estimate | 123 | 2.3 | 84,673 | 4.1 | ||||
| EDUCATION | ||||||||
| Veteran Population Age 25 or Older Estimate | 39,137 | (X) | 17,199,716 | (X) | ||||
| Veteran Population Age 25 or Older: Less Than High School Graduate Estimate | 1,114 | 2.8 | 902,424 | 5.2 | ||||
| Veteran Population Age 25 or Older: High School Graduate Estimate | 7,503 | 19.2 | 4,728,547 | 27.5 | ||||
| Veteran Population Age 25 or Older: Some College and AA Degree, Less Than BA Degree Estimate | 19,290 | 49.3 | 6,413,978 | 37.3 | ||||
| Veteran Population Age 25 or Older: BA Degree or More Estimate | 11,230 | 28.7 | 5,154,767 | 30.0 | ||||
State Profile: North Carolina (NC)
View another State Profile:
Over one-third of veterans served in the Vietnam era
In 2021, the VA guaranteed over 1.2 million home mortgage loans