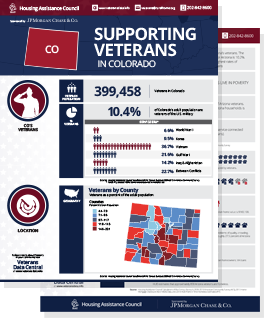
General Demographics for Veterans
El Paso County, Colorado
Source: ACS 2017-21 Five-Year National Estimates Veterans Select Demographic Data.
Run New Report
|
Data Reliability About Data
|
El Paso County, Colorado |
United States |
||||||
| VETERAN POPULATION | Number | Percent | Reliability | Number | Percent | |||
| Total Civilian Population Age 18 or Older Estimate | 518,821 | (X) | 254,296,179 | (X) | ||||
| Veteran Population Age 18 or Older Estimate | 85,941 | 16.6 | 17,431,290 | 6.9 | ||||
| Male Veteran Population Age 18 or Older Estimate | 72,476 | 84.3 | 15,794,025 | 90.6 | ||||
| Female Veteran Population Age 18 or Older Estimate | 13,465 | 15.7 | 1,637,265 | 9.4 | ||||
| AGE | ||||||||
| Veteran Population Age 18 or Older Estimate | 85,941 | (X) | 17,431,290 | (X) | ||||
| Veteran Population Ages 18 to 34 Estimate | 13,684 | 15.9 | 1,508,193 | 8.7 | ||||
| Male Veteran Population Ages 18 to 34 Estimate | 10,508 | 76.8 | 1,236,709 | 82.0 | ||||
| Female Veteran Population Ages 18 to 34 Estimate | 3,176 | 23.2 | 271,484 | 18.0 | ||||
| Veteran Population Ages 35 to 54 Estimate | 29,901 | 34.8 | 4,151,603 | 23.8 | ||||
| Male Veteran Population Ages 35 to 54 Estimate | 24,043 | 80.4 | 3,508,488 | 84.5 | ||||
| Female Veteran Population Ages 35 to 54 Estimate | 5,858 | 19.6 | 643,115 | 15.5 | ||||
| Veteran Population Ages 55 to 64 Estimate | 17,223 | 20.0 | 3,189,141 | 18.3 | ||||
| Male Veteran Population Ages 55 to 64 Estimate | 14,471 | 84.0 | 2,796,781 | 87.7 | ||||
| Female Veteran Population Ages 55 to 64 Estimate | 2,752 | 16.0 | 392,360 | 12.3 | ||||
| Veteran Population Ages 65 to 74 Estimate | 15,278 | 17.8 | 4,513,992 | 25.9 | ||||
| Male Veteran Population Ages 65 to 74 Estimate | 13,979 | 91.5 | 4,306,898 | 95.4 | ||||
| Female Veteran Population Ages 65 to 74 Estimate | 1,299 | 8.5 | 207,094 | 4.6 | ||||
| Veteran Population Ages 75 or Older Estimate | 9,855 | 11.5 | 4,068,361 | 23.3 | ||||
| Male Veteran Population Ages 75 or Older Estimate | 9,475 | 96.1 | 3,945,149 | 97.0 | ||||
| Female Veteran Population Ages 75 or Older Estimate | 380 | 3.9 | 123,212 | 3.0 | ||||
| PERIOD OF SERVICE | ||||||||
| Veteran Population Age 18 or Older Estimate | 85,941 | (X) | 17,431,290 | (X) | ||||
| Veteran Population Age 18 or Older: Served in Gulf War II Estimate | 37,830 | 44.0 | 3,843,757 | 22.1 | ||||
| Veteran Population Age 18 or Older: Served in Gulf War I Estimate | 33,926 | 39.5 | 3,908,610 | 22.4 | ||||
| Veteran Population Age 18 or Older: Served in Vietnam War Estimate | 22,078 | 25.7 | 6,084,415 | 34.9 | ||||
| Veteran Population Age 18 or Older: Served in Korean War Estimate | 2,896 | 3.4 | 1,149,257 | 6.6 | ||||
| Veteran Population Age 18 or Older: Served in WW II Estimate | 395 | 0.5 | 383,739 | 2.2 | ||||
| Veteran Population Age 18 or Older: Served Pre WW II Estimate | 0.0 | 3,926 | 0.0 | |||||
| Veteran Population Age 18 or Older: Did Not Serve During War Estimate | 10,822 | 12.6 | 3,885,010 | 22.3 | ||||
| RACE AND ETHNICITY | ||||||||
| Veteran Population Age 18 or Older Estimate | 85,941 | (X) | 17,431,290 | (X) | ||||
| White Alone-Includes Hispanic Veterans Estimate | 68,214 | 79.4 | 13,825,031 | 79.3 | ||||
| Black Alone-Includes Hispanic Veterans Estimate | 8,009 | 9.3 | 2,129,670 | 12.2 | ||||
| Native American /Alaska Native Alone-Includes Hispanic Veterans Estimate | 725 | 0.8 | 125,374 | 0.7 | ||||
| Asian Alone-Includes Hispanic Veterans Estimate | 1,632 | 1.9 | 310,477 | 1.8 | ||||
| Native Hawaiian/Other Pacific Islander Alone-Includes Hispanic Veterans Estimate | 210 | 0.2 | 34,529 | 0.2 | ||||
| Some Other Race Alone-Includes Hispanic Veterans Estimate | 2,545 | 3.0 | 321,587 | 1.8 | ||||
| Two Plus Races Alone-Includes Hispanic Veterans Estimate | 4,606 | 5.4 | 684,622 | 3.9 | ||||
| White Non-Hispanic Veterans Estimate | 63,773 | 74.2 | 13,119,437 | 75.3 | ||||
| Hispanic Veterans Estimate | 9,145 | 10.6 | 1,336,206 | 7.7 | ||||
| SERVICE-CONNECTED DISABILITY RATING | ||||||||
| Veteran Population Age 18 or Older Estimate | 85,941 | (X) | 17,431,290 | (X) | ||||
| Veterans with Service-Connected Disability Rating Estimate | 34,807 | 40.5 | 4,437,140 | 25.5 | ||||
| POVERTY | ||||||||
| Veterans with Poverty and Disability Status Determined Estimate | 85,285 | (X) | 17,157,125 | (X) | ||||
| Veterans Living Below The Poverty Level Estimate | 4,880 | 5.7 | 1,175,255 | 6.8 | ||||
| DISABILITY | ||||||||
| Veterans with Poverty and Disability Status Determined Estimate | 85,285 | (X) | 17,157,125 | (X) | ||||
| Veterans with a Disability Estimate | 20,822 | 24.4 | 5,059,887 | 29.5 | ||||
| Veterans with a Disability Living Below the Poverty Level Estimate | 2,006 | 9.6 | 488,736 | 9.7 | ||||
| EMPLOYMENT AND UNEMPLOYMENT | ||||||||
| Veteran Population 18 to 64 in Labor Force Estimate | 48,441 | (X) | 6,809,906 | (X) | ||||
| Veteran Population 18 to 64 in Labor Force Employed Estimate | 46,195 | 95.4 | (X) | (X) | ||||
| Veteran Population 18 to 64 in Labor Force: Unemployed Estimate | 2,246 | 4.6 | 296,291 | 4.4 | ||||
| Veteran Population 18 to 34 in Labor Force Estimate | 10,875 | (X) | 1,240,602 | (X) | ||||
| Veteran Population 18 to 34 in Labor Force: Employed Estimate | 10,160 | 93.4 | 1,166,284 | 94.0 | ||||
| Veteran Population 18 to 34 in Labor Force: Unemployed Estimate | 715 | 6.6 | 74,318 | 6.0 | ||||
| Veteran Population 35 to 54 in Labor Force | 25,737 | (X) | (X) | (X) | ||||
| Veteran Population 35 to 54 in Labor Force: Employed | 24,664 | 95.8 | (X) | (X) | ||||
| Veteran Population 35 to 54 in Labor Force: Unemployed Estimate | 1,073 | 4.2 | 137,300 | 3.9 | ||||
| Veteran Population 55 to 64 in Labor Force Estimate | 11,829 | (X) | 2,054,167 | (X) | ||||
| Veteran Population 55 to 64 in Labor Force: Employed Estimate | 11,371 | 96.1 | 1,969,494 | 95.9 | ||||
| Veteran Population 55 to 64 in Labor Force: Unemployed Estimate | 458 | 3.9 | 84,673 | 4.1 | ||||
| EDUCATION | ||||||||
| Veteran Population Age 25 or Older Estimate | 83,662 | (X) | 17,199,716 | (X) | ||||
| Veteran Population Age 25 or Older: Less Than High School Graduate Estimate | 1,699 | 2.0 | 902,424 | 5.2 | ||||
| Veteran Population Age 25 or Older: High School Graduate Estimate | 12,057 | 14.4 | 4,728,547 | 27.5 | ||||
| Veteran Population Age 25 or Older: Some College and AA Degree, Less Than BA Degree Estimate | 32,629 | 39.0 | 6,413,978 | 37.3 | ||||
| Veteran Population Age 25 or Older: BA Degree or More Estimate | 37,277 | 44.6 | 5,154,767 | 30.0 | ||||
State Profile: Colorado (CO)
View another State Profile:
Approximately 2.9 million veterans live in homes with one or more major problems of quality, crowding, or cost.
Nearly 8 in 10 veterans are homeowners