General Demographics for Veterans
Schuylkill County, Pennsylvania
Source: ACS 2019-23 Five-Year National Estimates Veterans Select Demographic Data.
Run New Report
|
Data Reliability About Data
|
Schuylkill County, Pennsylvania |
United States |
||||||
| VETERAN POPULATION | Number | Percent | Reliability | Number | Percent | |||
| Total Civilian Population Age 18 or Older Estimate | 114,612 | (X) | 257,456,135 | (X) | ||||
| Veteran Population Age 18 or Older Estimate | 8,413 | 7.3 | 16,569,149 | 6.4 | ||||
| Male Veteran Population Age 18 or Older Estimate | 7,842 | 93.2 | 14,907,774 | 90.0 | ||||
| Female Veteran Population Age 18 or Older Estimate | 571 | 6.8 | 1,661,375 | 10.0 | ||||
| AGE | ||||||||
| Veteran Population Age 18 or Older Estimate | 8,413 | (X) | 16,569,149 | (X) | ||||
| Veteran Population Ages 18 to 34 Estimate | 384 | 4.6 | 1,390,967 | 8.4 | ||||
| Male Veteran Population Ages 18 to 34 Estimate | 313 | 81.5 | 1,138,276 | 81.8 | ||||
| Female Veteran Population Ages 18 to 34 Estimate | 71 | 18.5 | 252,691 | 18.2 | ||||
| Veteran Population Ages 35 to 54 Estimate | 1,838 | 21.8 | 3,948,537 | 23.8 | ||||
| Male Veteran Population Ages 35 to 54 Estimate | 1,651 | 89.8 | 3,313,277 | 83.9 | ||||
| Female Veteran Population Ages 35 to 54 Estimate | 187 | 10.2 | 635,260 | 16.1 | ||||
| Veteran Population Ages 55 to 64 Estimate | 1,411 | 16.8 | 3,070,764 | 18.5 | ||||
| Male Veteran Population Ages 55 to 64 Estimate | 1,217 | 86.3 | 2,666,294 | 86.8 | ||||
| Female Veteran Population Ages 55 to 64 Estimate | 194 | 13.7 | 404,470 | 13.2 | ||||
| Veteran Population Ages 65 to 74 Estimate | 2,284 | 27.1 | 3,988,264 | 24.1 | ||||
| Male Veteran Population Ages 65 to 74 Estimate | 2,225 | 97.4 | 3,742,300 | 93.8 | ||||
| Female Veteran Population Ages 65 to 74 Estimate | 59 | 2.6 | 245,964 | 6.2 | ||||
| Veteran Population Ages 75 or Older Estimate | 2,496 | 29.7 | 4,170,617 | 25.2 | ||||
| Male Veteran Population Ages 75 or Older Estimate | 2,436 | 97.6 | 4,047,627 | 97.1 | ||||
| Female Veteran Population Ages 75 or Older Estimate | 60 | 2.4 | 122,990 | 2.9 | ||||
| PERIOD OF SERVICE | ||||||||
| Veteran Population Age 18 or Older Estimate | 8,413 | (X) | 16,569,149 | (X) | ||||
| Veteran Population Age 18 or Older: Served in Gulf War II Estimate | 1,407 | 16.7 | 4,099,161 | 24.7 | ||||
| Veteran Population Age 18 or Older: Served in Gulf War I Estimate | 1,579 | 18.8 | 3,928,611 | 23.7 | ||||
| Veteran Population Age 18 or Older: Served in Vietnam War Estimate | 3,005 | 35.7 | 5,625,942 | 34.0 | ||||
| Veteran Population Age 18 or Older: Served in Korean War Estimate | 560 | 6.7 | 861,161 | 5.2 | ||||
| Veteran Population Age 18 or Older: Served in WW II Estimate | 116 | 1.4 | 219,388 | 1.3 | ||||
| Veteran Population Age 18 or Older: Served Pre WW II Estimate | 0.0 | 1,767 | 0.0 | |||||
| Veteran Population Age 18 or Older: Did Not Serve During War Estimate | 2,372 | 28.2 | 3,638,865 | 22.0 | ||||
| RACE AND ETHNICITY | ||||||||
| Veteran Population Age 18 or Older Estimate | 8,413 | (X) | 16,569,149 | (X) | ||||
| White Alone-Includes Hispanic Veterans Estimate | 8,132 | 96.7 | 12,630,168 | 76.2 | ||||
| Black Alone-Includes Hispanic Veterans Estimate | 121 | 1.4 | 2,067,924 | 12.5 | ||||
| Native American /Alaska Native Alone-Includes Hispanic Veterans Estimate | 8 | 0.1 | 114,560 | 0.7 | ||||
| Asian Alone-Includes Hispanic Veterans Estimate | 0.0 | 315,480 | 1.9 | |||||
| Native Hawaiian/Other Pacific Islander Alone-Includes Hispanic Veterans Estimate | 2 | 0.0 | 32,858 | 0.2 | ||||
| Some Other Race Alone-Includes Hispanic Veterans Estimate | 13 | 0.2 | 399,984 | 2.4 | ||||
| Two Plus Races Alone-Includes Hispanic Veterans Estimate | 137 | 1.6 | 1,008,175 | 6.1 | ||||
| White Non-Hispanic Veterans Estimate | 7,992 | 95.0 | 12,178,530 | 73.5 | ||||
| Hispanic Veterans Estimate | 229 | 2.7 | 1,367,140 | 8.3 | ||||
| SERVICE-CONNECTED DISABILITY RATING | ||||||||
| Veteran Population Age 18 or Older Estimate | 8,413 | (X) | 16,569,149 | (X) | ||||
| Veterans with Service-Connected Disability Rating Estimate | 1,635 | 19.4 | 4,663,141 | 28.1 | ||||
| POVERTY | ||||||||
| Veterans with Poverty and Disability Status Determined Estimate | 8,049 | (X) | 16,297,619 | (X) | ||||
| Veterans Living Below The Poverty Level Estimate | 672 | 8.3 | 1,168,046 | 7.2 | ||||
| DISABILITY | ||||||||
| Veterans with Poverty and Disability Status Determined Estimate | 8,049 | (X) | 16,297,619 | (X) | ||||
| Veterans with a Disability Estimate | 2,913 | 36.2 | 4,924,117 | 30.2 | ||||
| Veterans with a Disability Living Below the Poverty Level Estimate | 332 | 11.4 | 497,132 | 10.1 | ||||
| EMPLOYMENT AND UNEMPLOYMENT | ||||||||
| Veteran Population 18 to 64 in Labor Force Estimate | 2,769 | (X) | 6,478,181 | (X) | ||||
| Veteran Population 18 to 64 in Labor Force Employed Estimate | 2,614 | 94.4 | (X) | (X) | ||||
| Veteran Population 18 to 64 in Labor Force: Unemployed Estimate | 155 | 5.6 | 266,138 | 4.1 | ||||
| Veteran Population 18 to 34 in Labor Force Estimate | 364 | (X) | 1,146,954 | (X) | ||||
| Veteran Population 18 to 34 in Labor Force: Employed Estimate | 295 | 81.0 | 1,078,153 | 94.0 | ||||
| Veteran Population 18 to 34 in Labor Force: Unemployed Estimate | 69 | 19.0 | 68,801 | 6.0 | ||||
| Veteran Population 35 to 54 in Labor Force | 1,487 | (X) | (X) | (X) | ||||
| Veteran Population 35 to 54 in Labor Force: Employed | 1,407 | 94.6 | (X) | (X) | ||||
| Veteran Population 35 to 54 in Labor Force: Unemployed Estimate | 80 | 5.4 | 124,426 | 3.7 | ||||
| Veteran Population 55 to 64 in Labor Force Estimate | 918 | (X) | 2,009,299 | (X) | ||||
| Veteran Population 55 to 64 in Labor Force: Employed Estimate | 912 | 99.3 | 1,936,388 | 96.4 | ||||
| Veteran Population 55 to 64 in Labor Force: Unemployed Estimate | 6 | 0.7 | 72,911 | 3.6 | ||||
| EDUCATION | ||||||||
| Veteran Population Age 25 or Older Estimate | 8,351 | (X) | 16,356,359 | (X) | ||||
| Veteran Population Age 25 or Older: Less Than High School Graduate Estimate | 596 | 7.1 | 778,894 | 4.8 | ||||
| Veteran Population Age 25 or Older: High School Graduate Estimate | 4,003 | 47.9 | 4,428,090 | 27.1 | ||||
| Veteran Population Age 25 or Older: Some College and AA Degree, Less Than BA Degree Estimate | 2,634 | 31.5 | 6,059,287 | 37.0 | ||||
| Veteran Population Age 25 or Older: BA Degree or More Estimate | 1,118 | 13.4 | 5,090,088 | 31.1 | ||||
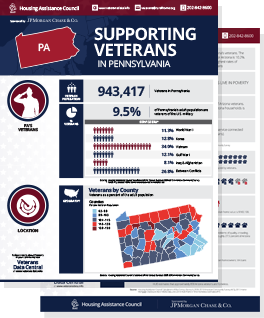
State Profile: Pennsylvania (PA)
View another State Profile:
There are more than 1.6 million women veterans
28.1% of veterans have a service connected disability rating