General Demographics for Veterans
Maricopa County, Arizona
Source: ACS 2019-23 Five-Year National Estimates Veterans Select Demographic Data.
Run New Report
|
Data Reliability About Data
|
Maricopa County, Arizona |
United States |
||||||
| VETERAN POPULATION | Number | Percent | Reliability | Number | Percent | |||
| Total Civilian Population Age 18 or Older Estimate | 3,459,157 | (X) | 257,456,135 | (X) | ||||
| Veteran Population Age 18 or Older Estimate | 238,646 | 6.9 | 16,569,149 | 6.4 | ||||
| Male Veteran Population Age 18 or Older Estimate | 215,039 | 90.1 | 14,907,774 | 90.0 | ||||
| Female Veteran Population Age 18 or Older Estimate | 23,607 | 9.9 | 1,661,375 | 10.0 | ||||
| AGE | ||||||||
| Veteran Population Age 18 or Older Estimate | 238,646 | (X) | 16,569,149 | (X) | ||||
| Veteran Population Ages 18 to 34 Estimate | 23,081 | 9.7 | 1,390,967 | 8.4 | ||||
| Male Veteran Population Ages 18 to 34 Estimate | 19,443 | 84.2 | 1,138,276 | 81.8 | ||||
| Female Veteran Population Ages 18 to 34 Estimate | 3,638 | 15.8 | 252,691 | 18.2 | ||||
| Veteran Population Ages 35 to 54 Estimate | 58,248 | 24.4 | 3,948,537 | 23.8 | ||||
| Male Veteran Population Ages 35 to 54 Estimate | 49,645 | 85.2 | 3,313,277 | 83.9 | ||||
| Female Veteran Population Ages 35 to 54 Estimate | 8,603 | 14.8 | 635,260 | 16.1 | ||||
| Veteran Population Ages 55 to 64 Estimate | 40,475 | 17.0 | 3,070,764 | 18.5 | ||||
| Male Veteran Population Ages 55 to 64 Estimate | 34,801 | 86.0 | 2,666,294 | 86.8 | ||||
| Female Veteran Population Ages 55 to 64 Estimate | 5,674 | 14.0 | 404,470 | 13.2 | ||||
| Veteran Population Ages 65 to 74 Estimate | 54,919 | 23.0 | 3,988,264 | 24.1 | ||||
| Male Veteran Population Ages 65 to 74 Estimate | 51,593 | 93.9 | 3,742,300 | 93.8 | ||||
| Female Veteran Population Ages 65 to 74 Estimate | 3,326 | 6.1 | 245,964 | 6.2 | ||||
| Veteran Population Ages 75 or Older Estimate | 61,923 | 25.9 | 4,170,617 | 25.2 | ||||
| Male Veteran Population Ages 75 or Older Estimate | 59,557 | 96.2 | 4,047,627 | 97.1 | ||||
| Female Veteran Population Ages 75 or Older Estimate | 2,366 | 3.8 | 122,990 | 2.9 | ||||
| PERIOD OF SERVICE | ||||||||
| Veteran Population Age 18 or Older Estimate | 238,646 | (X) | 16,569,149 | (X) | ||||
| Veteran Population Age 18 or Older: Served in Gulf War II Estimate | 59,997 | 25.1 | 4,099,161 | 24.7 | ||||
| Veteran Population Age 18 or Older: Served in Gulf War I Estimate | 56,517 | 23.7 | 3,928,611 | 23.7 | ||||
| Veteran Population Age 18 or Older: Served in Vietnam War Estimate | 81,537 | 34.2 | 5,625,942 | 34.0 | ||||
| Veteran Population Age 18 or Older: Served in Korean War Estimate | 11,666 | 4.9 | 861,161 | 5.2 | ||||
| Veteran Population Age 18 or Older: Served in WW II Estimate | 2,822 | 1.2 | 219,388 | 1.3 | ||||
| Veteran Population Age 18 or Older: Served Pre WW II Estimate | 35 | 0.0 | 1,767 | 0.0 | ||||
| Veteran Population Age 18 or Older: Did Not Serve During War Estimate | 50,318 | 21.1 | 3,638,865 | 22.0 | ||||
| RACE AND ETHNICITY | ||||||||
| Veteran Population Age 18 or Older Estimate | 238,646 | (X) | 16,569,149 | (X) | ||||
| White Alone-Includes Hispanic Veterans Estimate | 186,909 | 78.3 | 12,630,168 | 76.2 | ||||
| Black Alone-Includes Hispanic Veterans Estimate | 16,561 | 6.9 | 2,067,924 | 12.5 | ||||
| Native American /Alaska Native Alone-Includes Hispanic Veterans Estimate | 3,375 | 1.4 | 114,560 | 0.7 | ||||
| Asian Alone-Includes Hispanic Veterans Estimate | 3,817 | 1.6 | 315,480 | 1.9 | ||||
| Native Hawaiian/Other Pacific Islander Alone-Includes Hispanic Veterans Estimate | 397 | 0.2 | 32,858 | 0.2 | ||||
| Some Other Race Alone-Includes Hispanic Veterans Estimate | 8,253 | 3.5 | 399,984 | 2.4 | ||||
| Two Plus Races Alone-Includes Hispanic Veterans Estimate | 19,334 | 8.1 | 1,008,175 | 6.1 | ||||
| White Non-Hispanic Veterans Estimate | 175,825 | 73.7 | 12,178,530 | 73.5 | ||||
| Hispanic Veterans Estimate | 32,141 | 13.5 | 1,367,140 | 8.3 | ||||
| SERVICE-CONNECTED DISABILITY RATING | ||||||||
| Veteran Population Age 18 or Older Estimate | 238,646 | (X) | 16,569,149 | (X) | ||||
| Veterans with Service-Connected Disability Rating Estimate | 59,719 | 25.0 | 4,663,141 | 28.1 | ||||
| POVERTY | ||||||||
| Veterans with Poverty and Disability Status Determined Estimate | 236,524 | (X) | 16,297,619 | (X) | ||||
| Veterans Living Below The Poverty Level Estimate | 16,411 | 6.9 | 1,168,046 | 7.2 | ||||
| DISABILITY | ||||||||
| Veterans with Poverty and Disability Status Determined Estimate | 236,524 | (X) | 16,297,619 | (X) | ||||
| Veterans with a Disability Estimate | 66,011 | 27.9 | 4,924,117 | 30.2 | ||||
| Veterans with a Disability Living Below the Poverty Level Estimate | 6,863 | 10.4 | 497,132 | 10.1 | ||||
| EMPLOYMENT AND UNEMPLOYMENT | ||||||||
| Veteran Population 18 to 64 in Labor Force Estimate | 97,432 | (X) | 6,478,181 | (X) | ||||
| Veteran Population 18 to 64 in Labor Force Employed Estimate | 93,376 | 95.8 | (X) | (X) | ||||
| Veteran Population 18 to 64 in Labor Force: Unemployed Estimate | 4,056 | 4.2 | 266,138 | 4.1 | ||||
| Veteran Population 18 to 34 in Labor Force Estimate | 19,457 | (X) | 1,146,954 | (X) | ||||
| Veteran Population 18 to 34 in Labor Force: Employed Estimate | 18,289 | 94.0 | 1,078,153 | 94.0 | ||||
| Veteran Population 18 to 34 in Labor Force: Unemployed Estimate | 1,168 | 6.0 | 68,801 | 6.0 | ||||
| Veteran Population 35 to 54 in Labor Force | 50,493 | (X) | (X) | (X) | ||||
| Veteran Population 35 to 54 in Labor Force: Employed | 48,407 | 95.9 | (X) | (X) | ||||
| Veteran Population 35 to 54 in Labor Force: Unemployed Estimate | 2,086 | 4.1 | 124,426 | 3.7 | ||||
| Veteran Population 55 to 64 in Labor Force Estimate | 27,482 | (X) | 2,009,299 | (X) | ||||
| Veteran Population 55 to 64 in Labor Force: Employed Estimate | 26,680 | 97.1 | 1,936,388 | 96.4 | ||||
| Veteran Population 55 to 64 in Labor Force: Unemployed Estimate | 802 | 2.9 | 72,911 | 3.6 | ||||
| EDUCATION | ||||||||
| Veteran Population Age 25 or Older Estimate | 235,420 | (X) | 16,356,359 | (X) | ||||
| Veteran Population Age 25 or Older: Less Than High School Graduate Estimate | 9,358 | 4.0 | 778,894 | 4.8 | ||||
| Veteran Population Age 25 or Older: High School Graduate Estimate | 47,459 | 20.2 | 4,428,090 | 27.1 | ||||
| Veteran Population Age 25 or Older: Some College and AA Degree, Less Than BA Degree Estimate | 95,447 | 40.5 | 6,059,287 | 37.0 | ||||
| Veteran Population Age 25 or Older: BA Degree or More Estimate | 83,156 | 35.3 | 5,090,088 | 31.1 | ||||
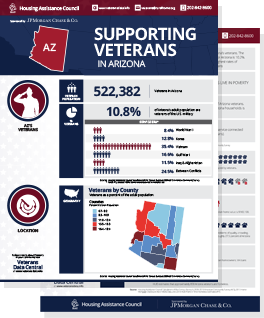
State Profile: Arizona (AZ)
View another State Profile:
4.1% - Unemployment rate for veterans
HUD estimates that nearly 32,782 veterans are homeless